|
||
|
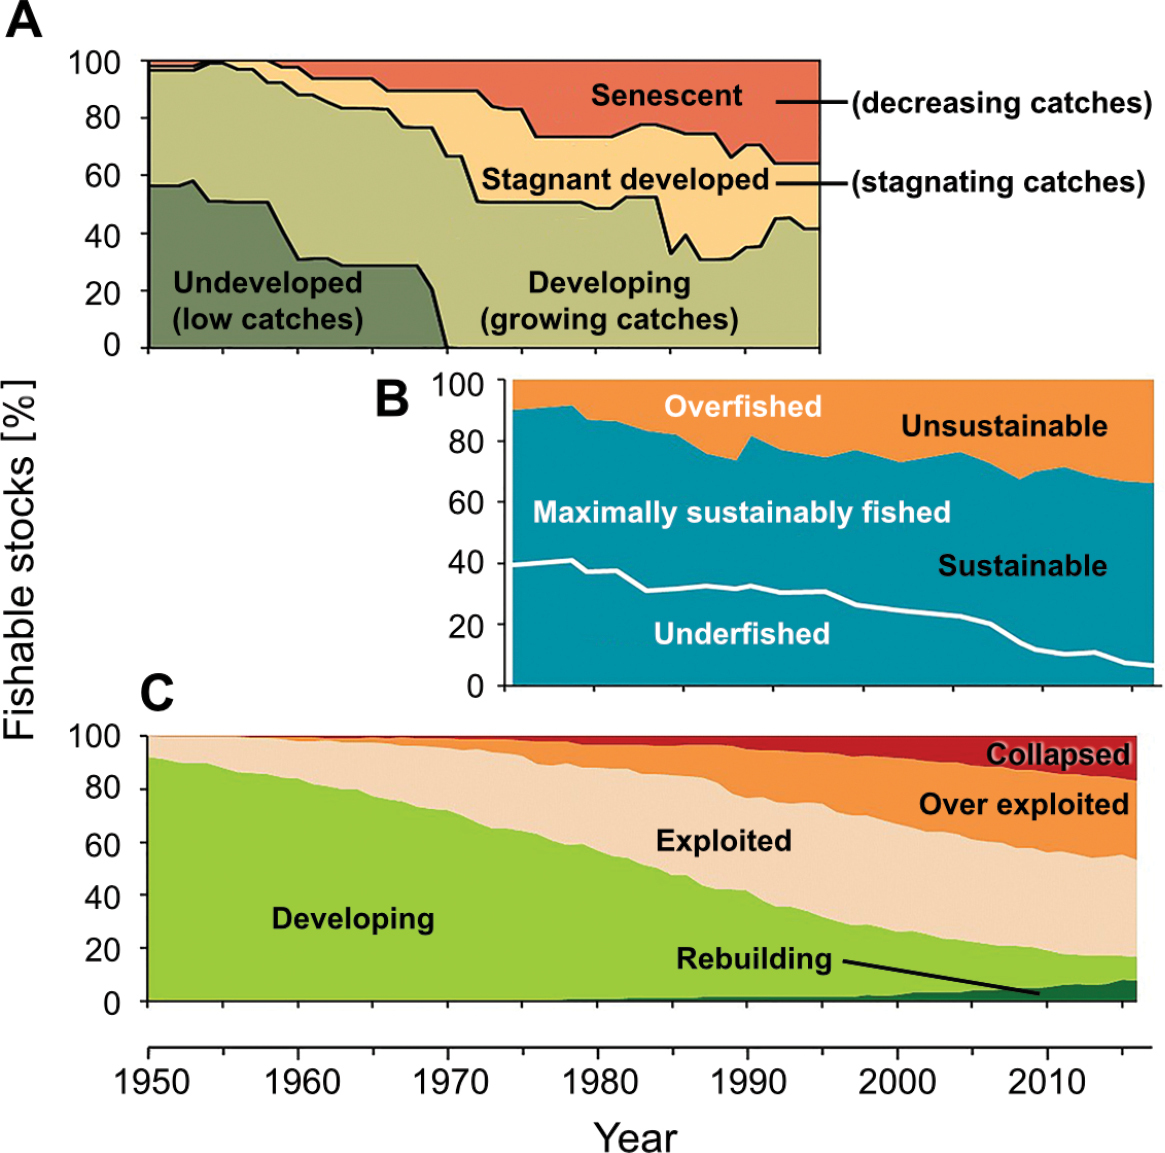
Common versions of “catch-only” assessments, which may be verified against real stock assessments: A: The key graph in Grainger and Garcia (1996), for which the status of the world’s marine exploited stocks was inferred from the slope of polynomials fitted to catch time series, as subsequently done for years by FAO; B: Reproduction of fig. 19 in SOFIA (FAO 2020), which summarizes the status of global stocks based on an opaque mix of methods ranging from real stock assessments to subjective interpretation of catch trends in data-poor fisheries (see Ye 2011); C: Stock status plots based on the simplification of the catch-only method in A by Froese and Kesner-Reyes (2002), as implemented by Pauly et al. (2008) to work with the catch “reconstructed” globally by the Sea Around Us. Note that C considers stock rebuilding, but that, as a whole, A, B, and C convey the same message. |