|
||
|
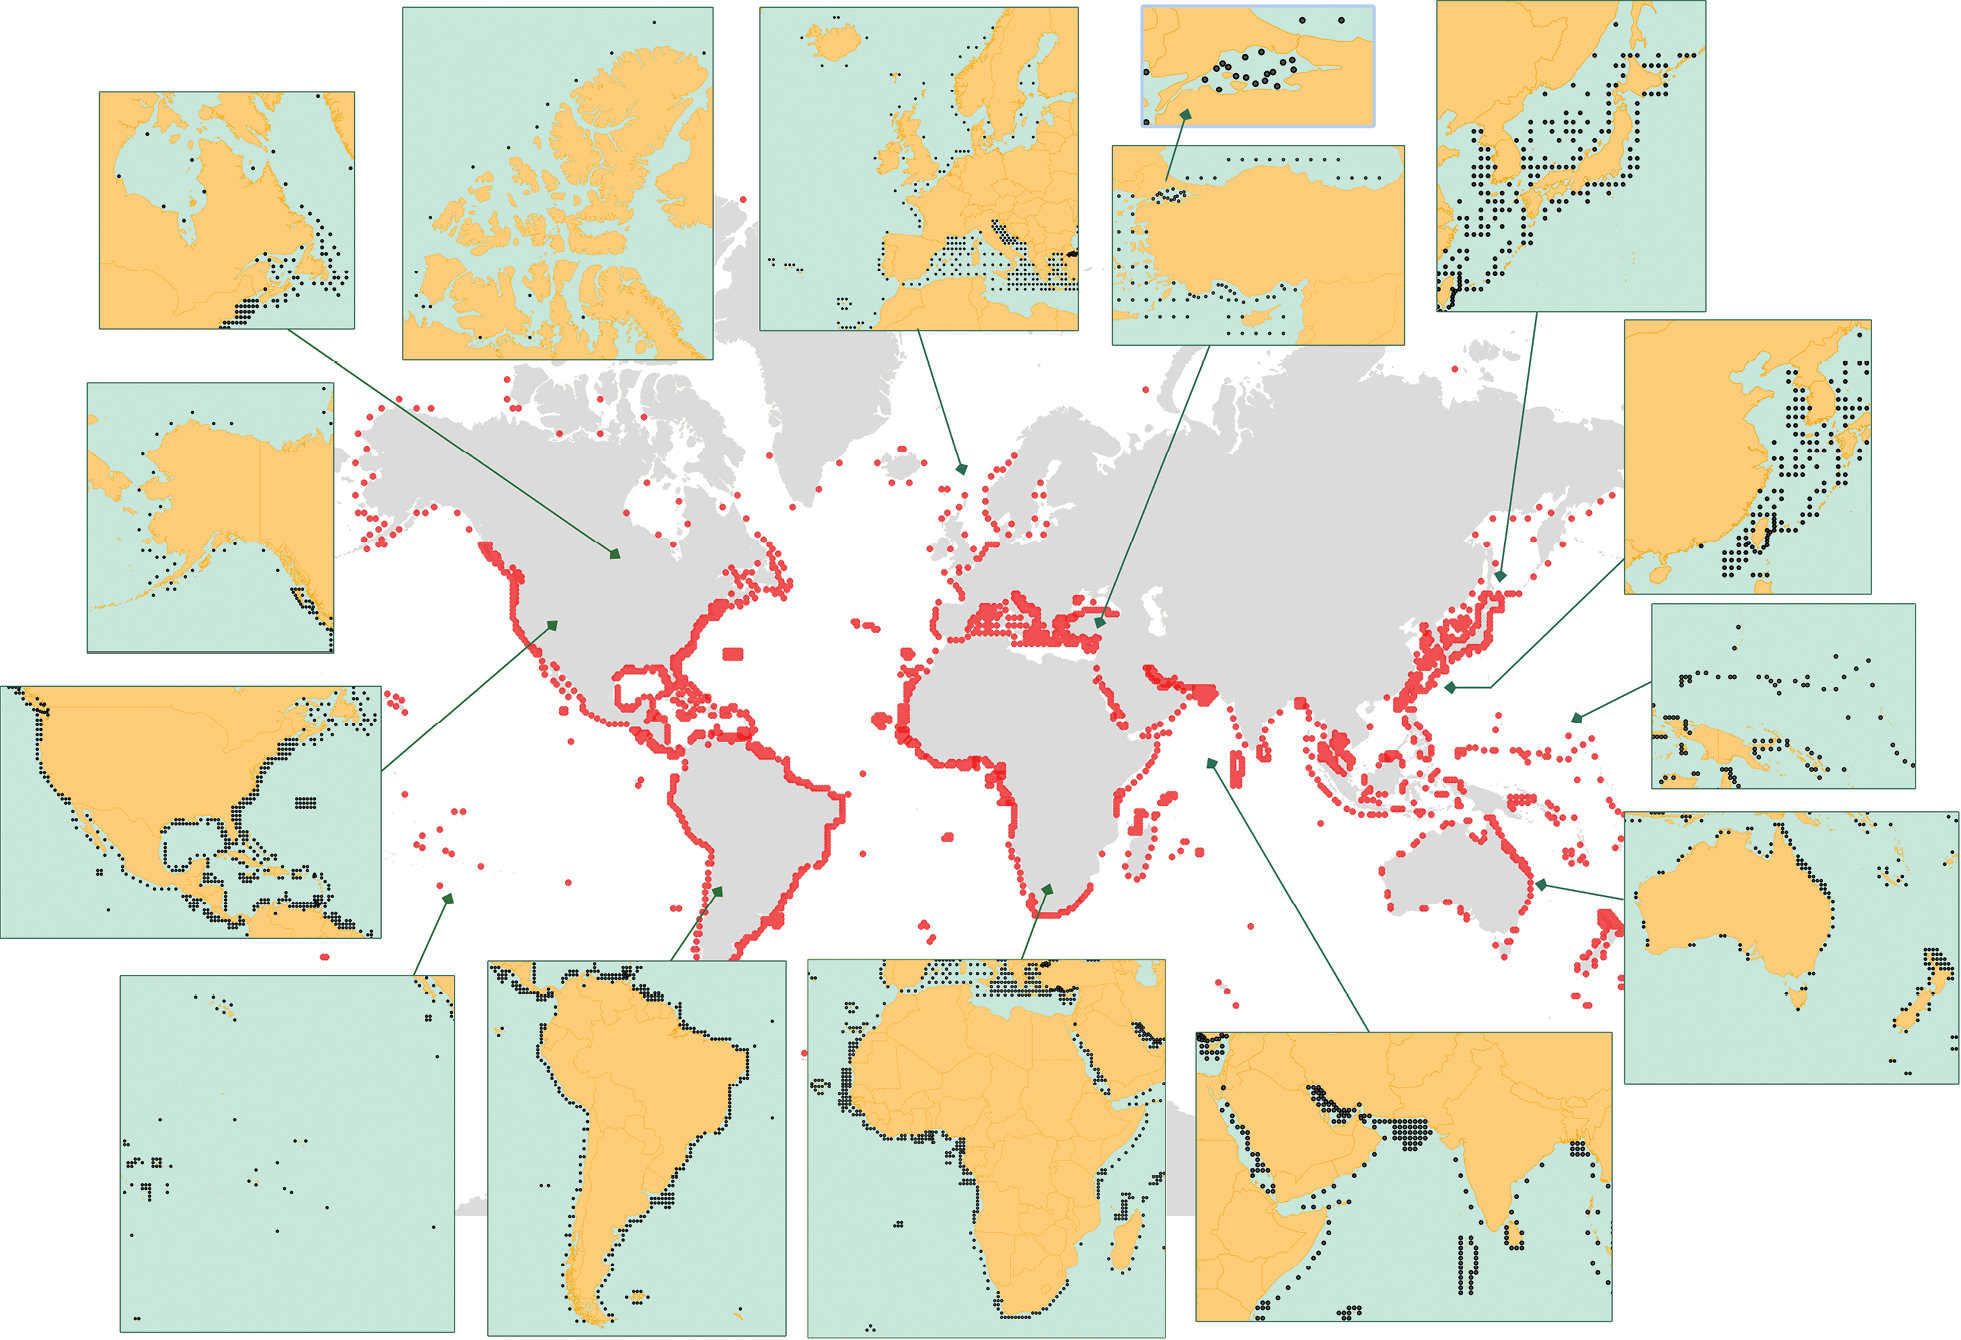
Maps showing the locations of the centroids of the over 2000 stock assessments performed with CMSY (~20%) and CMSY ++ (~80%) in all parts of the world. Generally, the assessments in wealthier countries (USA, Canada, Australia, New Zealand, EU-member states) were complemented with CPUE or other ancillary data, and well-informed priors for the terminal B/k values; such information was often lacking for many countries in low latitudes, but the results still matched what was known of their fisheries. Based on original Sea Around Us data, and previous analyses in Froese et al. (2018a); Zhang et al. (2018); Demirel et al. (2020); Cruz et al. (2020); Schijns (2020); Liang et al. (2020); Roa-Ureta (2020); Wang et al. (2020a,b); Musinguzi et al. (2020); and Palomares et al. (2019, 2020a, 2020b). |