|
||
|
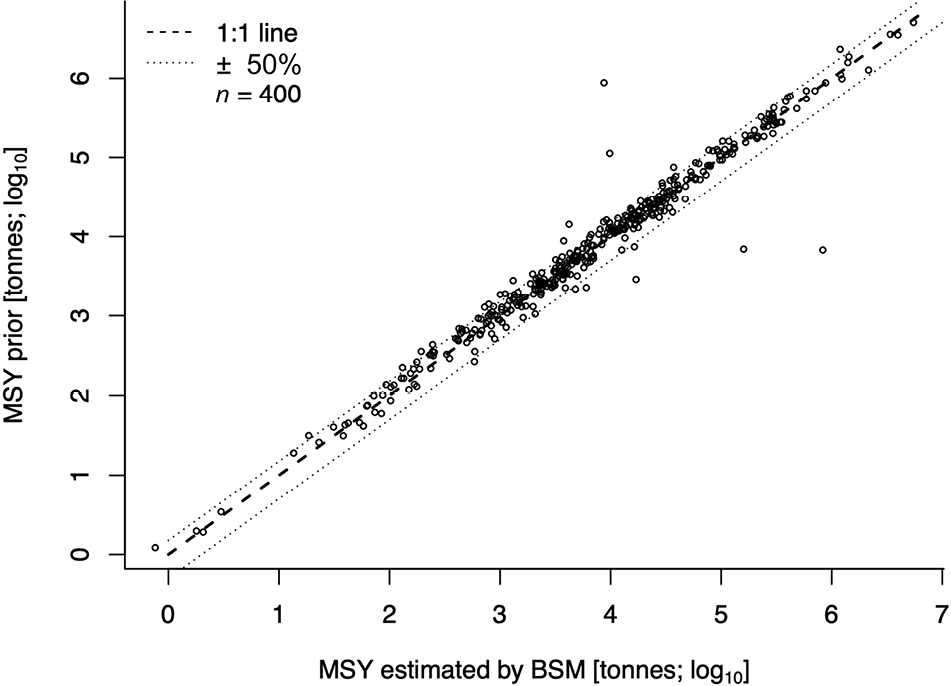
Plot of MSY prior derived from maximum catch over MSY estimated with BSM for the 400 stocks used for training ANN. The outliers are stocks where catches never exceeded MSY, for which neither CMSY nor the method to drive MSY priors should be used. The dashed 1:1 line indicates identical values whereas the dotted lines indicate deviations of ±50%. Note that CMSY++ estimates of MSY would fall vertically between the MSY priors and the 1:1 line. |