|
||
|
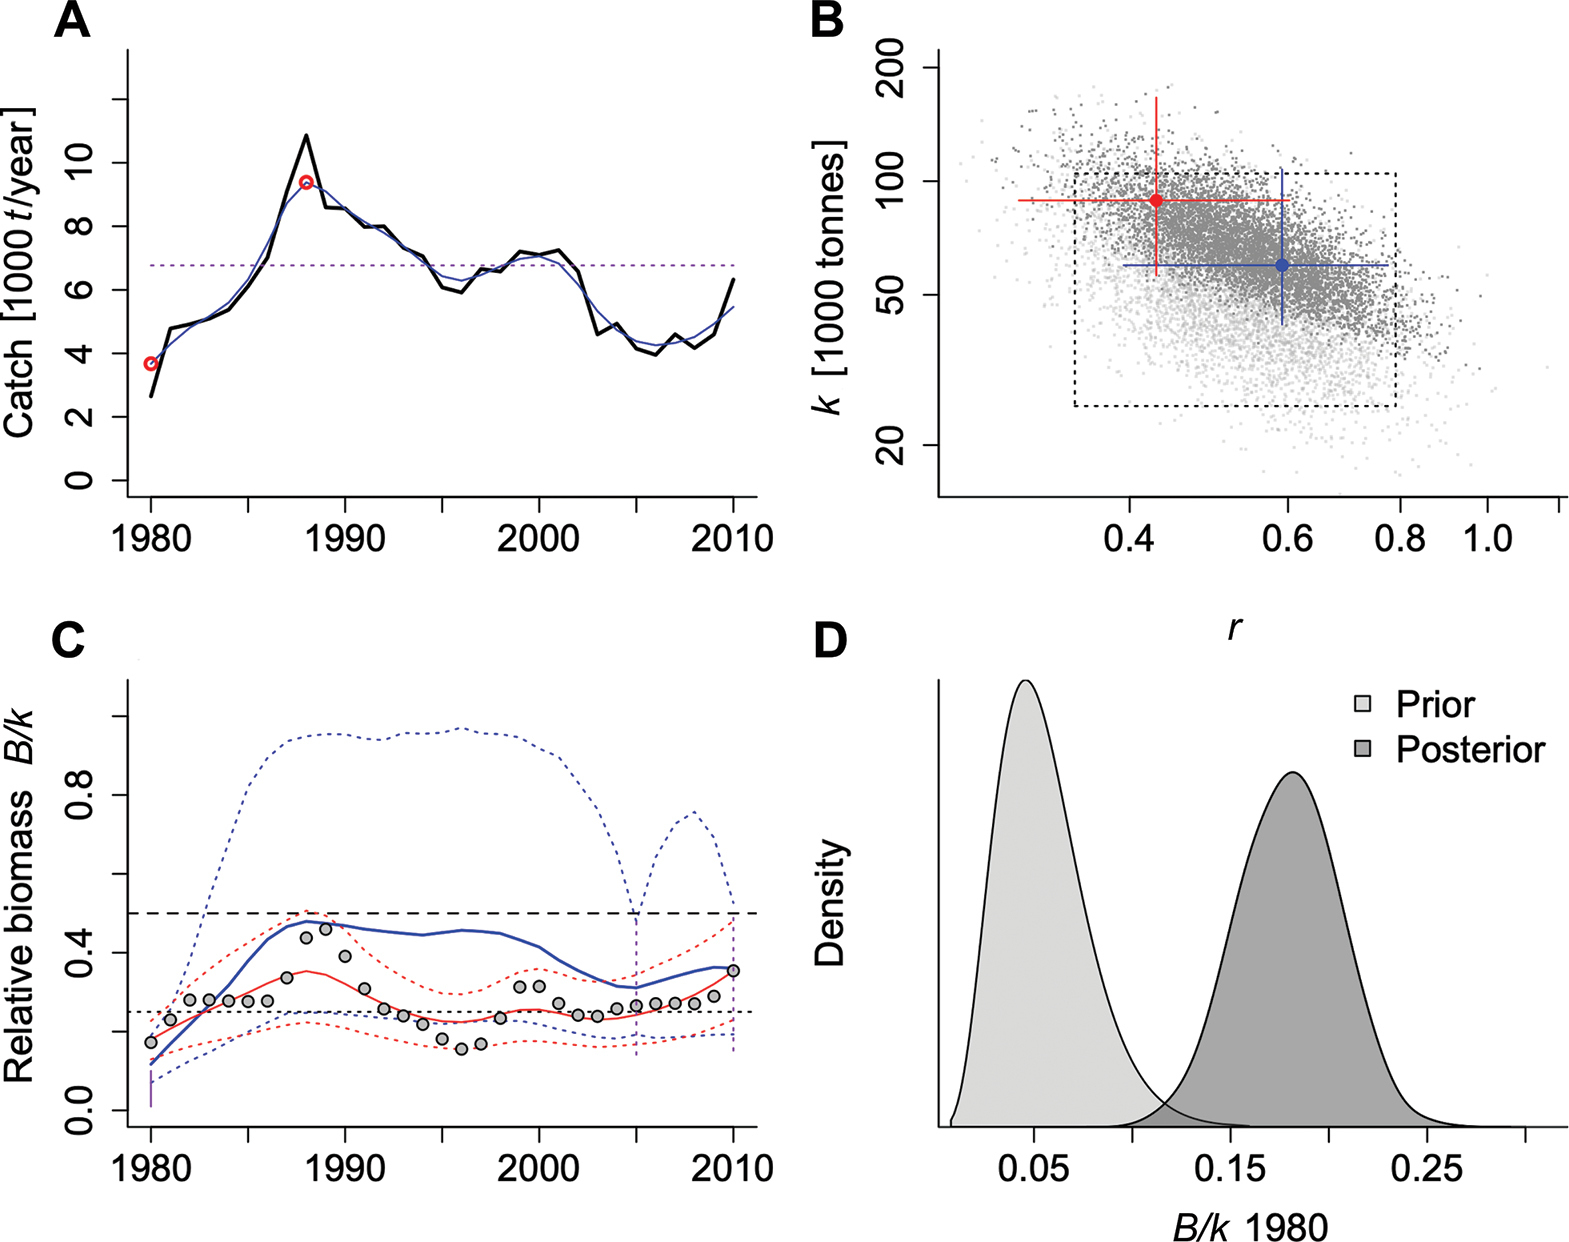
Examples of graphical output of CMSY++, here for European plaice (Pleuronectes platessa) in the eastern English Channel. Panel (A) shows the time series of catch from 1980 to 2011, with the thin blue curve representing smoothed catch and the red circles the smoothed minimum and maximum values. Panel (B) shows as dotted box the prior range for r and k. The dots in light grey indicate potential r–k pairs and the dark grey dots indicate pairs determined as viable by the catch-only CMSY++ analysis. The blue cross indicates the best CMSY++ estimate for r–k, with approximate 95% confidence limits. The red cross indicates the corresponding estimate derived from catch and CPUE by BSM. Panel (C) shows the time series of relative biomass B/k as estimated by CMSY++ (blue curve) and BSM (red curve) with dotted 95% confidence limits. The grey points indicate the available CPUE data. The horizontal lines indicate BMSY at 0.5 k and Blim at 0.25 k. The vertical purple line in the lower left corner indicates the B/k prior set by the user to 0.01–0.1. The dotted vertical lines in 2005 and 2011 are the prior B/k ranges set by the Neural Network. Panel (D) compares the density of the light-grey B/k prior set by the user for 1980 with the corresponding dark-grey posterior density estimated by BSM. |