|
||
|
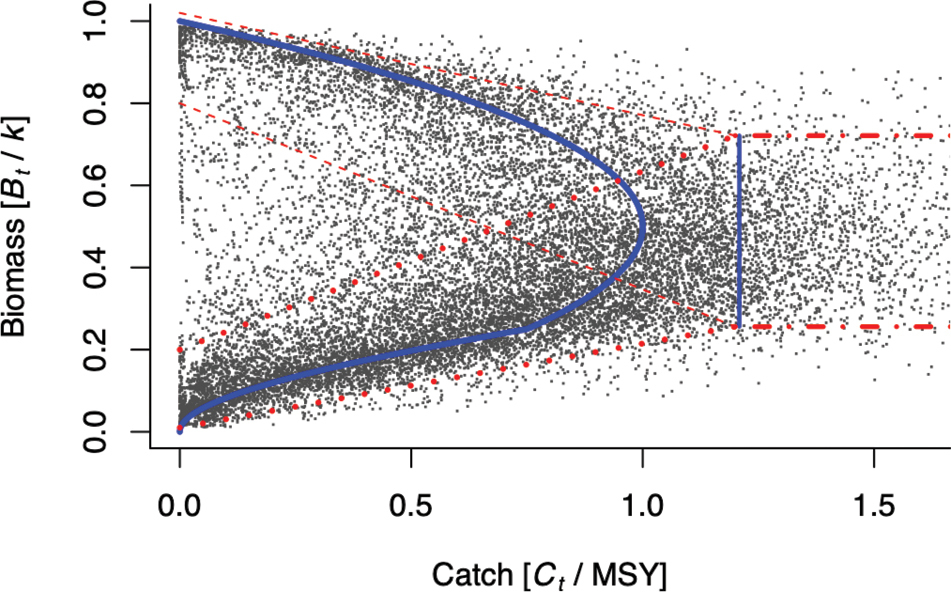
Scatterplot of relative biomass (Bt/k) over relative catch (Ct/MSY), both estimated with BSM, with 18 341 points for 400 stocks. The blue curve is the equilibrium biomass prediction from Equation 2. The vertical blue line indicates the range that contains 90% of the (Bt/k) points for catches above MSY. The red dashed lines indicate approximate 95% confidence ranges for prior Bt/k. |