|
||
|
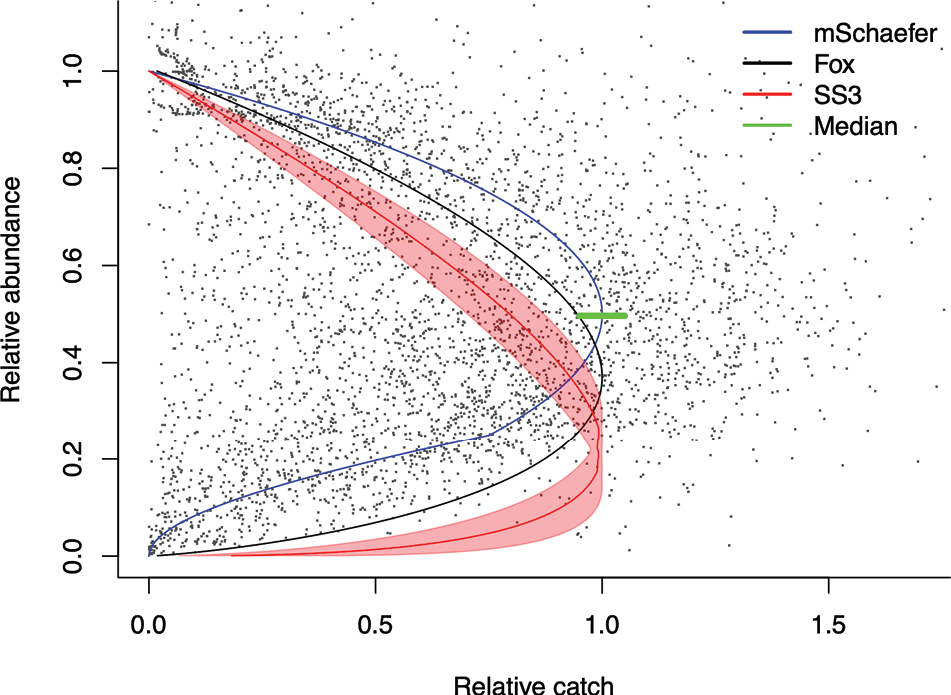
Scatterplot of 4805 observations of abundance relative to maximum abundance for 94 stocks where maximum abundance was deemed close to unexploited (B/k) and catch relative to a prior for MSY derived from maximum catch, i.e., no modelling was involved in generating the data. The upper blue curve represents the modified Schaefer model (mSchaefer) used by CMSY++. The middle black curve represents the Fox model. The lower red curve with approximate 95% confidence limits represents 14 stocks assessed with the Stock Synthesis model (SS3). The short green bold line indicates the median of relative population size = 0.497 for available points from 0.95 to 1.05 relative catch levels. |