|
||
|
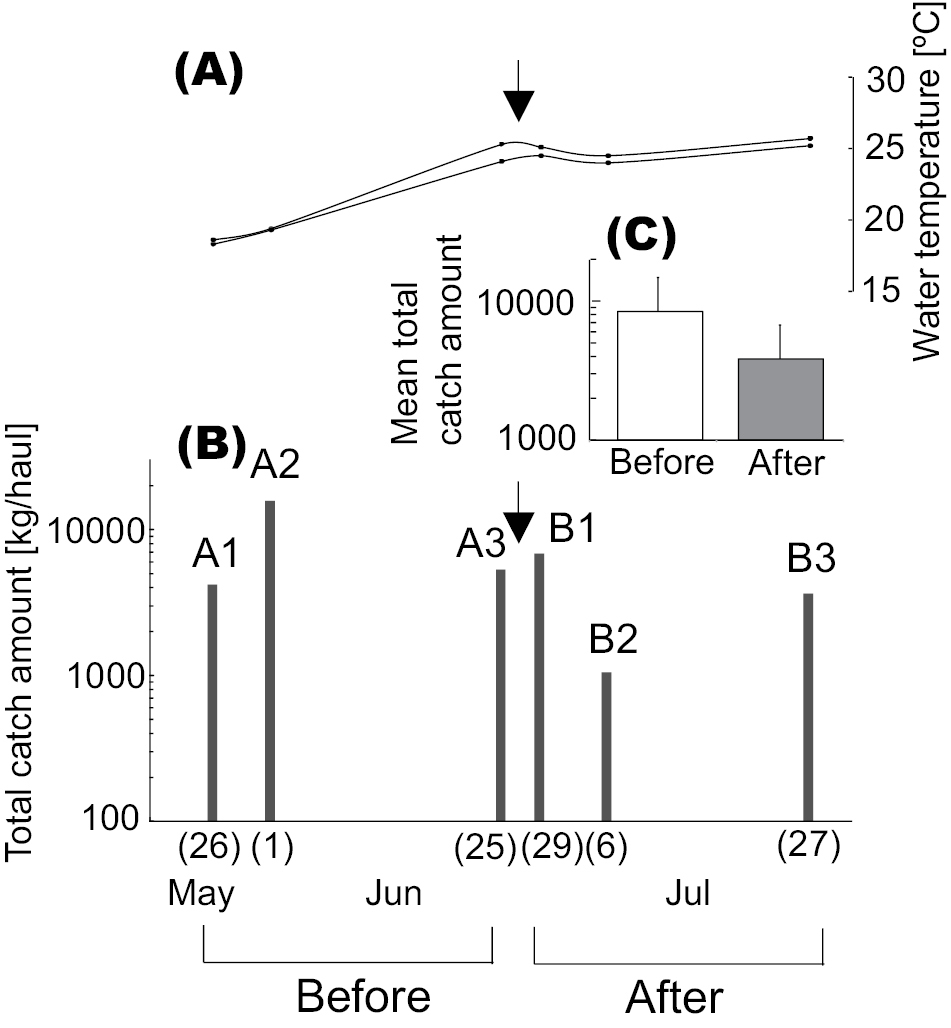
Changes in sea surface temperature and total catch amount during the experimental period in Tachibana Bay, Kyushu, Japan in 2011. A: Observed maximum and minimum sea surface temperature in the fishing ground, B: Total catch amount per haul, C: Mean total catch amount between ‘before’ and ‘after’ the passage of the typhoon. Data are means ± S.D. Arrows indicate the passage of the typhoon, A1~B3 indicate sample numbers and numbers in parentheses indicate dates. |