|
||
|
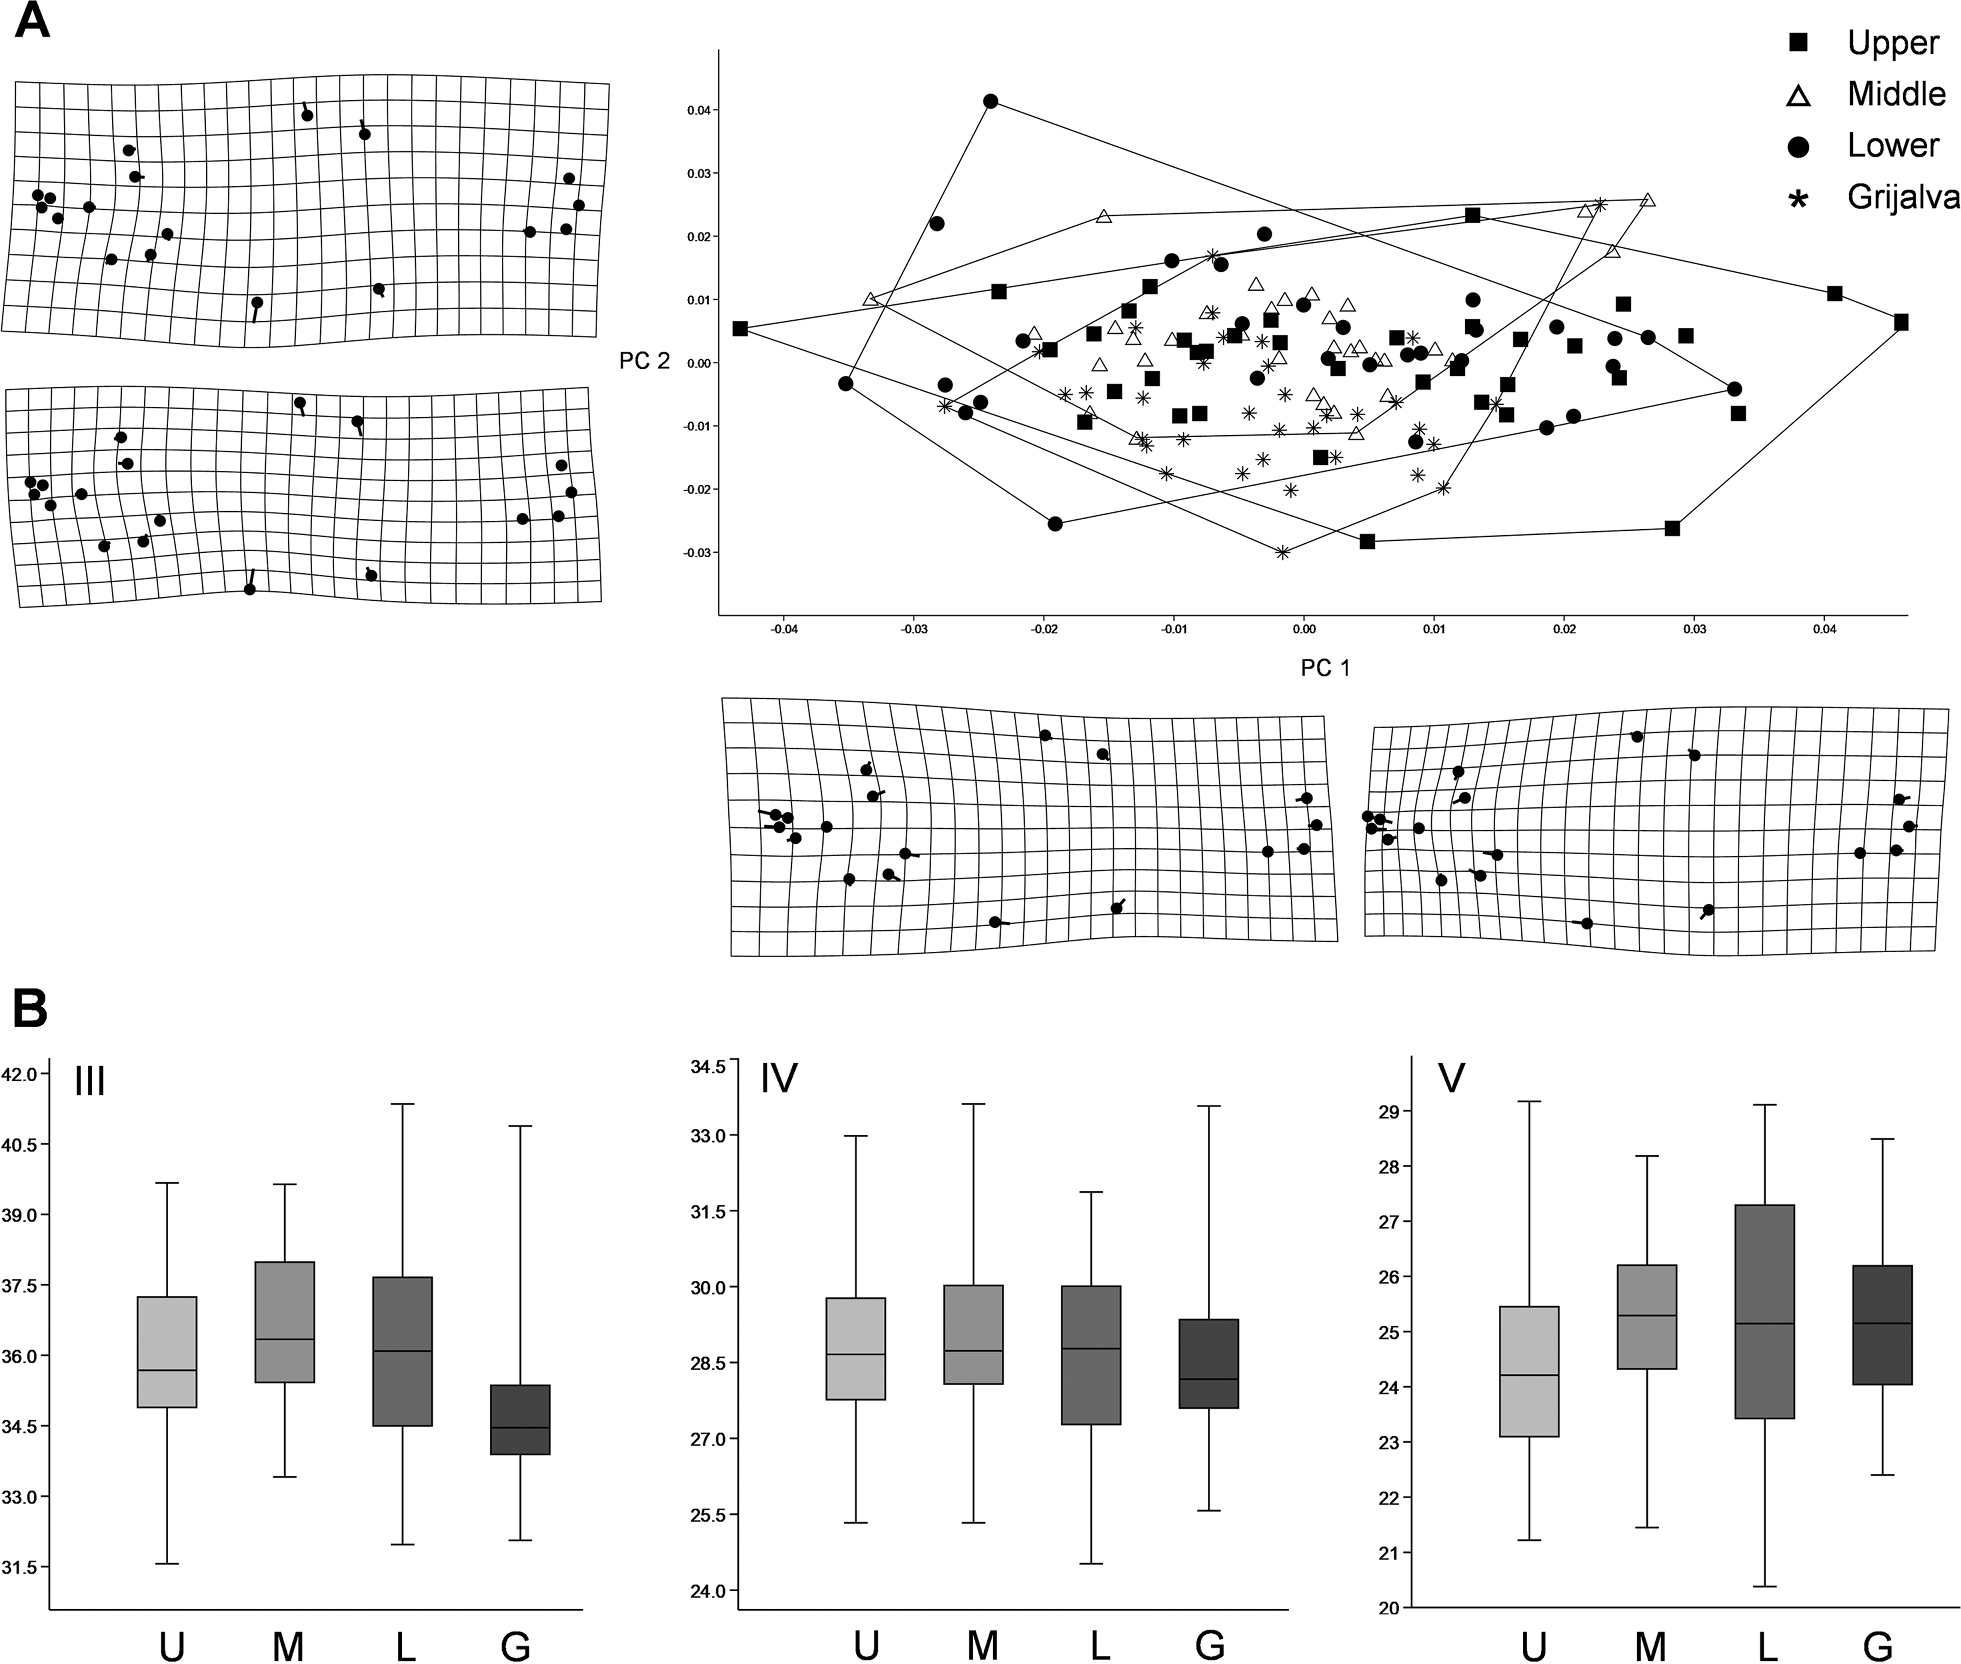
(A) Morphospace formed by PC1 (36.20%) and PC2 (18.94%) for Dorosoma anale. Squares represent the upper region, triangles represent the middle region, dots represent the lower region and stars represent the Grijalva region. Deformation grids are associated to the most negative and positive values of the PC1 and PC2. (B) discriminatory linear measures expressed in percent for D. anale. U = Upper, M = Middle, L = Lower, G = Grijalva. |