|
||
|
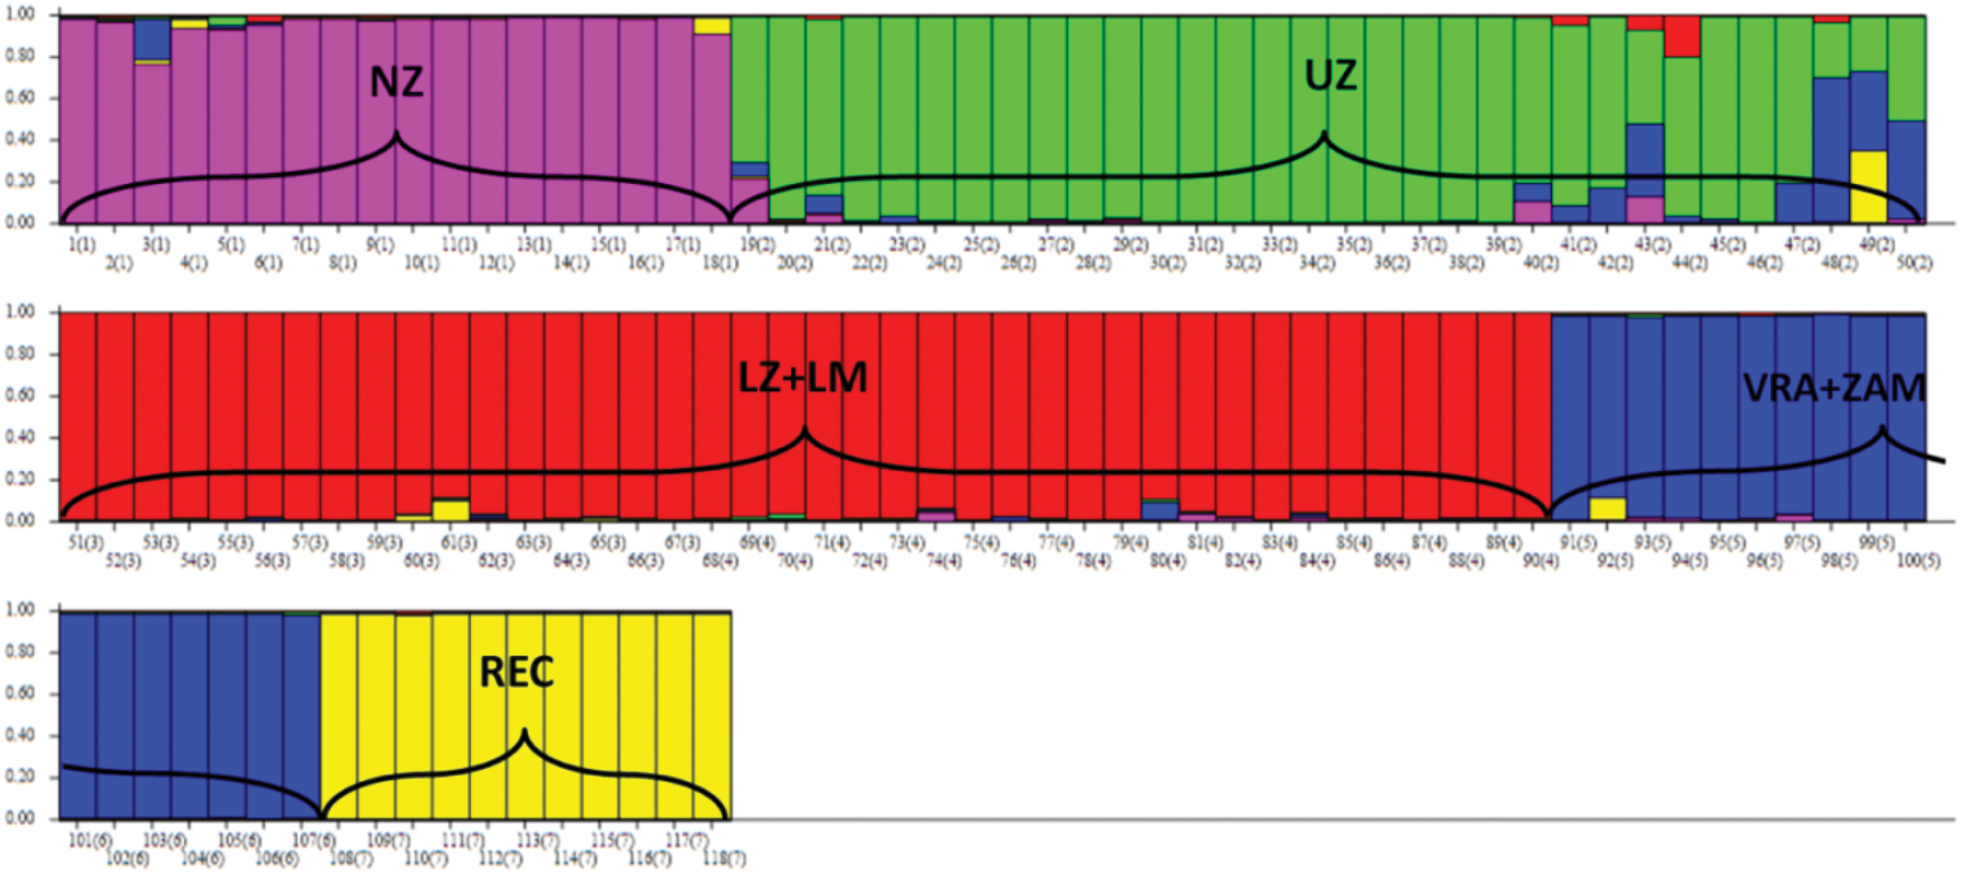
The STRUCTURE analysis reveals the distinct population status (represented by distinct colour) of particular brown trout populations (NZ, River Nožica; UZ, upper River Zeta; REC, River Rečka with one genetic cluster; VRA + ZAM, rivers Vratna and Zamna; LM + LZ, lower River Mrtvica and lower River Zeta as one genetic cluster in putative Adriatic trout) . Y-axis presents the participation of alleles from all populations (expressed as a fraction of individual genome ranging from 0–1) in the genome of each individual in all populations, while bars in the x-axis represent individuals and colour-assigned obtained genetic clusters i.e., populations. |